

The application of sensors and wireless networks makes it possible to monitor, analyze and evaluate landscape projects dynamically. Landscape architects can not only create space, but also carry out scientific research and performance evaluation by monitoring design.
In order to complete the process visualization and performance evaluation of landscape rainwater management, this study collected at one-minute intervals data of precipitation, interception, evaporation, soil water storage, infiltration and overflow in a closed watershed site.
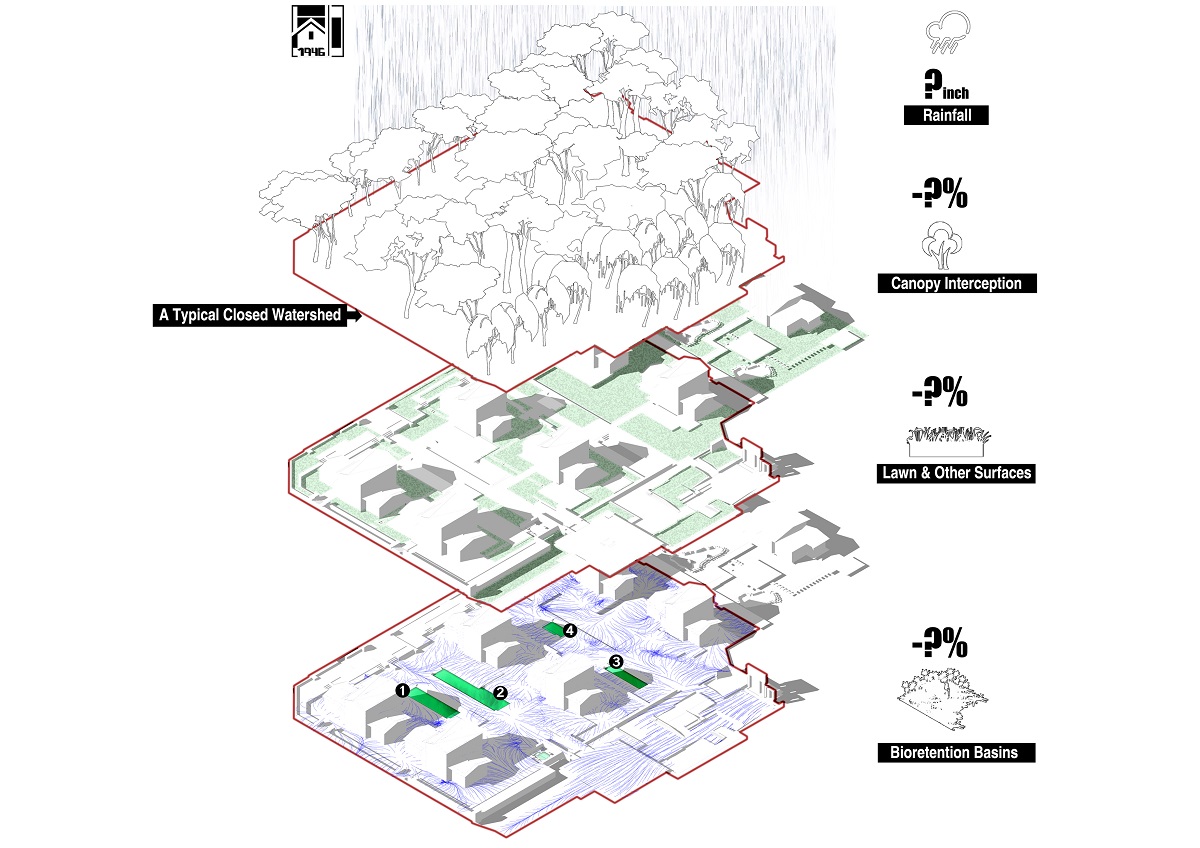
The monitoring site is a campus green space which can be seen as an endorheic basin (58848sf). 62% of the site is covered by 4 kinds of canopy trees. Due to the serious waterlogging problems after rainfall events, 4 bioretention gardens were designed to reduce surface runoff.
Monitoring design in this site should avoid affecting the normal use of the space and all the sensors need independent outdoor solar power supply (12V) for safety reasons.
To visualize the real rainfall process for deep understanding and landscape education: The rainfall process under experimental or simulated conditions is often quite different from the real scene. Real-time monitoring data helps landscape architects to understand various types of rainfall, interception of different canopy trees, soil water storage, and infiltration. Real rainfall process visualization works are the best teaching materials.
To assess the performance for better design: Differences between the pre-design simulation and the actual runoff reduction are quite inevitable and monitoring can reflect shortcomings in the design clearly. Monitoring system in this site was mainly used to determine whether the location and the capacity of 4 bioretention basins are reasonable.
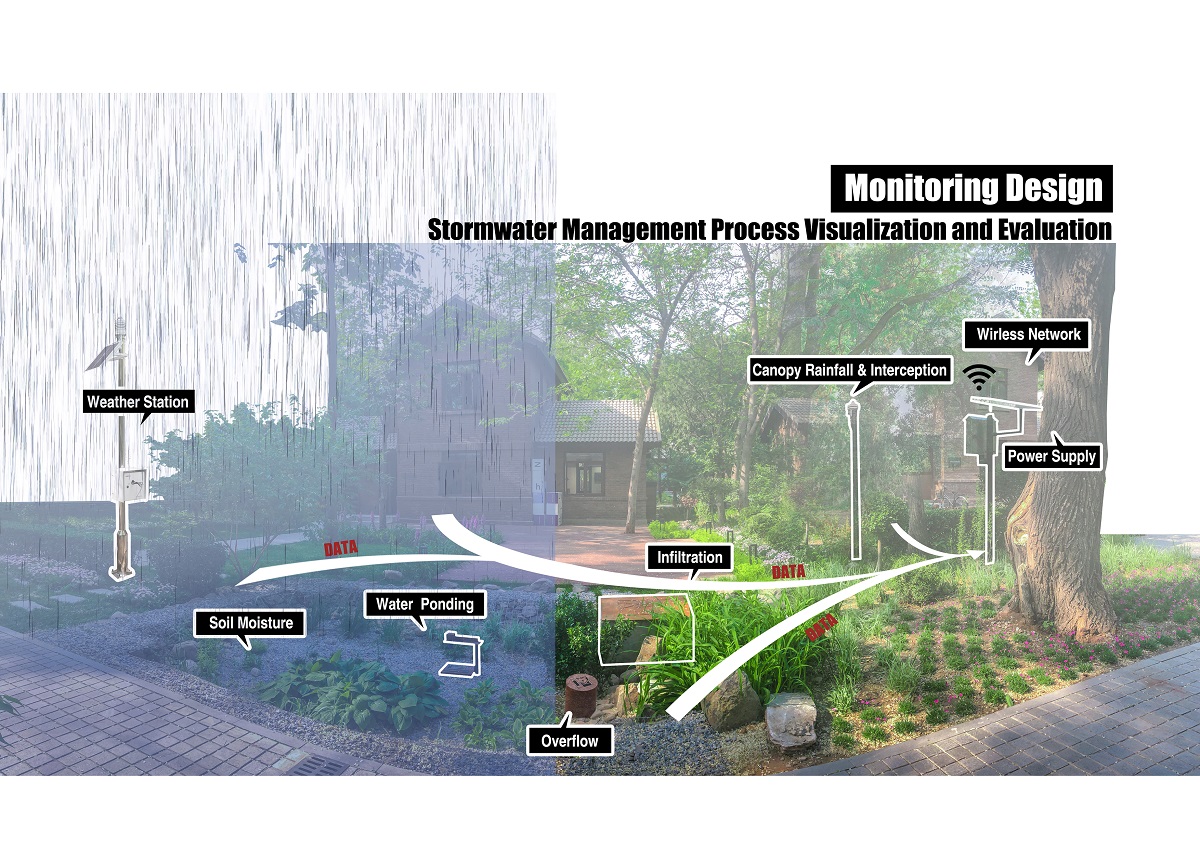
Research methods and monitoring system design: There is a prominent pattern of stormwater management in this site: rainfall—canopy interception—multiple surfaces runoff—bioretention basins reduction—overflow to water tank. Different sensors are used to monitor the flow reduction of all these stages except runoff generation of multiple surfaces which is hard to measure.
Precipitation and interception: infrared rain gauge.
Bioretention basins: water level sensors, soil moisture sensors and infiltration collecting installations;
Overflow: Open channel flowmeters with a parshall flume connected to an underground water tank.
All the sensors mentioned are powered by outdoor solar panels and battery. Data is actively collected by Data Transfer unit(DTU)after script programming and sent to a cloud server via LTE 4G network. Then the data is decoded and stored in the database. Data of temperature, humidity and PM 2.5 will be updated on the webpage.
In addition to the design of the monitoring devices, signal acquisition, data transmission, database programming and system construction are also very important in this study which requires cross-disciplinary research capabilities of landscape architects.
The construction of the system took 2 months and was finished by August 30, 2018, so it has been operating for almost 11 months. Removing abnormal data, the monitoring system has collected a total of 28 rainfall events (data of several events are incomplete due to power supply problems).
Important conclusions: -
Conclusions about canopy interception:
- Canopy trees affected the spatial and temporal distribution of the rainfall events on the site evidently, and in the 28 rainfall events monitored, total canopy interception ratio is 21.7%, holding nearly 75300 gals of runoff.
- Comparison of the 4 species: Salix matsudana Koidz. (67%)> Sophora japonica Linn. (52%) > Populus lasiocarpa Oliv. (50%) >Paulownia fortune (36%).
- Canopy rainfall occured earlier under the tiny blade trees like willow and scholar trees, but these trees intercepted more in total because of their high leaf-density.
- Canopy interception rate and maximum rainfall rate show a significant logarithm correlation with high fit degree (0.73).
Conclusions about the 4 bioretention basins in the site:
- The area of 4 rain gardens is 1288.4sf (only 2% of the site). In the 28 rainfall events, the total inflow of the site is 347450 gals, 15.5% of which is collected by the 4 bioretention basins (8.1% by infiltration and 7.4% by soil capacity). Rain gardens has played a certain role in reducing external runoff and the soil shows good water retention performance.
- Even in the same site, there is an obvious difference in soil moisture distribution of the bioretention basins, and in actual rainfall events, even open basins have specific runoff directions, which can be accurately identified by monitoring.
- The bioretention basins in this site played a significant role in collecting and reducing runoff under heavy rainfall and short, high-intensity rainfall events.
- High-precision monitoring data makes it possible to intensively visualize the whole rainfall process. Under different rainfall conditions, bioretention basin No. 2 always collected a large amount of external runoff effectively. Larger amounts of outside runoff were reduced by basin No. 4 during heavier rainfall events (rainfall>0.3 inch).
- Although the target runoff collection areas and the spatial locations are quite similar, basin No. 1 responded much less to runoff than No. 2. More data is needed to finally define whether the capacity of No. 1 is too large.
- The poor overall performance of basin No. 3 reflects the problem of its capacity design and site selection. Further design improvement is needed to optimize this area.
Major innovations:
- A set of monitoring indicators and methods for rainwater management are provided which have great potential for more applications in landscape architecture, encouraging landscape architects to design for monitoring in early stages of different projects.
- Images of rainfall process restoration are good materials for landscape and hydrology education. More and more materials will be updated as the system operates continually.
- Accuracy is improved, monitoring period is lengthened, and maintenance costs are reduced with the methods of online monitoring.
Overview
-
Project Name
Monitoring Design: Stormwater Management Process Visualization and Evaluation
-
Location
Shengyinyuan, Tsinghua University, Beijing, China
-
Category
Research, documentation and publication
-
Landscape Architect
Tsinghua University
-
Client
Tsinghua University
-
Brief
Monitoring analysis of stormwater management in landscape projects is much more accurate than hydrological calculations or simulations. For performance evaluation, high-precision data is needed but hard to come by. Aiming to find out how much runoff can be reduced by canopy trees, lawn, and bioretention basins with different levels of rainfall, this research uses a wireless sensor network (WSN) to visualize the whole rainfall process of a closed-watershed site named Shengyinyuan in Tsinghua University. Quantitative performance assessment has also been achieved with the minute-level data collected by the system. This study provides a set of monitoring indicators and methods for rainwater management which has great potential for more applications in landscape projects and can help landscape architects to evaluate post occupancy. On the other hand, the rainfall process visualization works are good materials for hydrology education. In the 28 rainfall events monitored in the site, canopy trees contributed more than 21% of the interception, and 4 bioretention basins achieved obvious runoff reduction (nearly 15.5% runoff collected by 2% area) especially in continuous, large and short, high-intensity rainfall events. Several important results indicated further design improvement in this site.
-
Awards
Finalist, Landscape Institute Awards 2019
Details
-
Project Team
- Project director and Faculty Advisor: Hailong LIU - Lead Researcher: Huaiyu ZHOU - Technical Support: Huiquan JIANG, Zijing LIU - Additional Faculty Advisor: Haifeng JIA - Construction and Equipment Support:LIM KOK SIAN, Yu SHANG, CHANG Yi-chang,Lang TANG, Jiangqiong PAN and Kun ZHAO, Jianxin YANG and Shuangshou LI
-
Year Completed
2018
-

Tsinghua University
-
Approximate Map Location

Location
Shengyinyuan, Tsinghua University, Beijing, China
-
Share


